
Test The Tax Theory: The Answer Will Shock You
- Edwin Preble
- Apr 4
- 4 min read

Let’s start with something we can all agree on in New Hampshire:
Property taxes go up every year.
And the explanation is always delivered with the same soothing tone people use when they’re about to charge you for something:
“It’s just the market.”
Sure. And my dog “just happened” to eat the entire Thanksgiving turkey.
Because here’s the deal—most of us didn’t suddenly add a second story, a marble staircase, and a heated driveway shaped like a bald eagle.
The house is the same. The land is the same. The road is the same.
So why does the bill keep climbing like it’s trying to summit Mount Washington in January?
Because the thing that quietly changed wasn’t your property.
It was the map that defines it—and the software that turns that map into a tax bill.
The Simple Timeline
Everyone Can Understand
(No Deed Decoder Ring Required)
Here’s the real-world version of our personal situation with “normal taxes” vs “something changed”:
2005: We Built the home
2014: Added a garage.
(Fair enough—value goes up, taxes go up.)
2014 → 2018: Only about $400 increase over four years.
That’s the boring, normal kind of increase where you grumble once and move on.
Then…
2019: The jump starts.
And it doesn’t stop.
This is the part where my “theory” stops being a theory and starts being… a pretty reasonable question.
Our Taxes over the past 20+years
2005 - $91,800 (built home)
2010 - $98,200 (assessment)
2010- $72,700 (billing statement ???)
2014 -$82,200 (garage added)
2017 - $96,000
2018 - $88,800
2019 - $113,000
2022 - $114,100
2023 - $251,900 (demolition as a supplemental)
2026 - $330,000
The Plot Twist of 2019:
“Let’s Remap the Whole Town”
In 2019, the town voted to raise and appropriate $118,000 to remap the entire town using:
digital aerial photography
compiled surveys on record
deed research
accurate measurements of all parcels
to create digital tax maps meeting DRA requirements.
ARTICLE 23 PASSED.
Translation:
“We upgraded the mapping system.”
And right around that same time?
A whole lot of people across New Hampshire started feeling the same thing:
My tax bill suddenly acts like it got a Red Bull sponsorship.
This isn’t just Ossipee. It’s the state—because towns all over moved into modern GIS mapping + mass-assessment systems.
What I’m Claiming
(In Plain English)
My theory is simple:
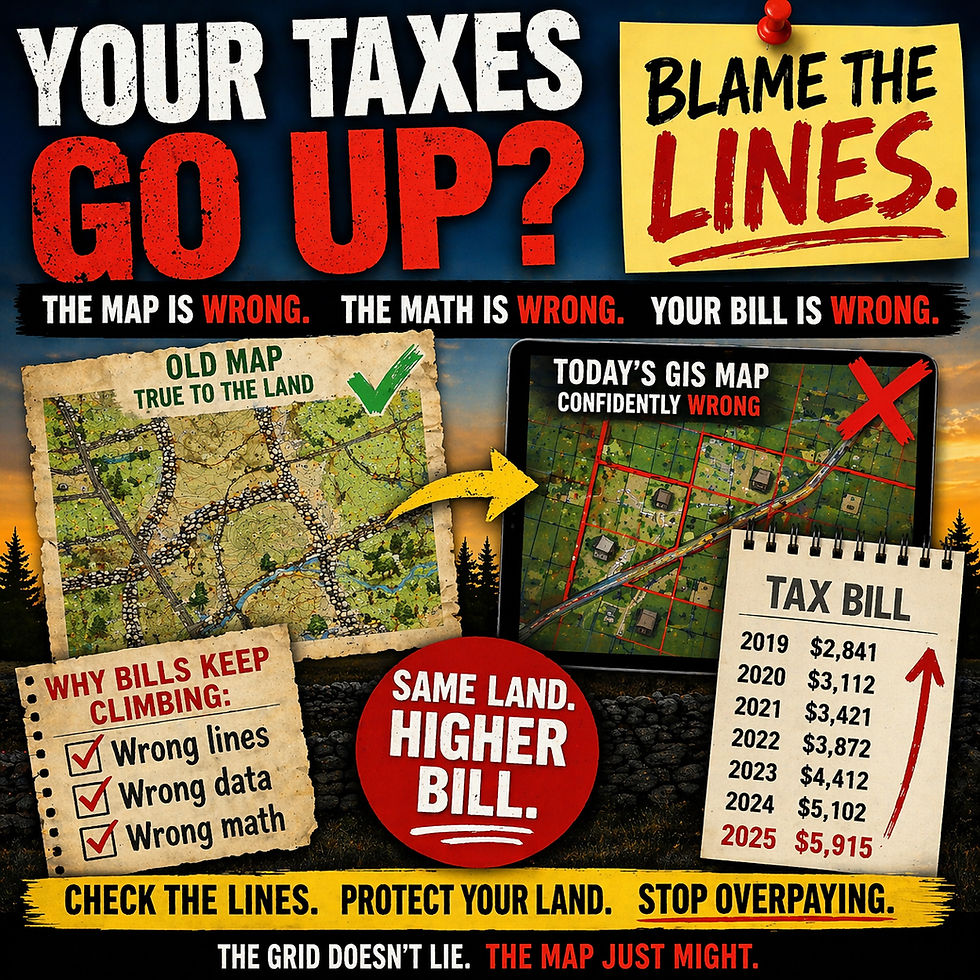
If the map layer is wrong, the math layer is wrong.
And if the math layer is wrong… your tax bill can rise even if you changed nothing.
Modern mapping systems (GSX/GIS-style platforms) don’t “walk the land.”
They don’t follow stone walls.
They don’t check old road corridors.
They do this:
✅ Take the parcel lines and features on the GIS
✅ Feed them into valuation algorithms
✅ Calculate land size, frontage, access, influence zones, “neighborhood” factors
✅ Spit out a number
✅ Mail you the bill like it’s a subscription service you forgot to cancel
So if the underlying lines are off—even a little—the software recalculates reality.
And you get billed for the picture, not the place.
The Best Part: You Don’t Have to “Believe Me.” You Can Test It.
This is what I want other people to do: test my theory on your own property.
No politics. No drama. No “trust me bro.”
Just a simple test anyone can do in ten minutes.
How to Test It (The “GSX vs. The Ground” Challenge)
Go to your town’s online tax map (GSX/AxisGIS/etc.) and pull up your parcel.
Now check these 4 things:
1)Do the parcel lines match what’s physically on the land?
Look for:
long stone walls
clear boundary markers
fence lines that have been “the line” forever
If the map line cuts through a wall like it’s playing Subway Surfers… that’s a red flag.
2)Do roads and corridors line up correctly?
Roads are supposed to be the easiest thing to get right.
If the GIS road centerline or layout looks “shifted” compared to reality, pay attention.
3)Do natural features sit where they should?
Streams, ponds, wetlands, old crossings—these aren’t suggestions.
If the features look displaced, you may be looking at a layer alignment problem.
4)Check your values before and after 2019
Look at your assessment history if it’s available:
Did your value behave normally up to 2018?
Did it jump starting around 2019 even without improvements?
Because that pattern is the whole point:
Same property + new mapping system = new math.
The “Land Doesn’t Lie” Rule
Here’s the reason this matters:
A software map can be edited.
A parcel line can be “adjusted.”
A boundary can be “interpreted.”
But a stone wall that’s been in the woods for 150 years?
That thing doesn’t care about your GIS settings.
So when GSX doesn’t align with physical land features, it’s not just a cartography issue.
It’s a taxation issue, because those digital lines are used to calculate value.
Why This Is Statewide.Not Just
“Those Weird Ossipee
People Again”)
If the taxes started rising sharply around the time towns adopted or expanded digital mapping and assessment tools, that’s not magic.
That’s a systems issue.
And if one town’s remap can move lines and change tax math—
imagine what happens when many towns do it.
That’s how you get a statewide vibe of:
“I didn’t do anything and my taxes still climbed.”
Same. Welcome to the club. The membership fee is apparently due every July.
Call to Action:
Test It, & See For Yourself.
If you want to help test my theory, here’s what to do:
Screenshot your parcel on GSX/AxisGIS
Screenshot the same spot with satellite view (or your own photo of walls/roads)
Note:
any misalignment
your tax/value jump years (especially 2018 → 2019)
If enough people can show the same pattern—
this stops being “a theory” and starts being a measurable problem.
And the best part?
Nobody has to argue about politics.
It’s just:
Does the map match the land? Yes or no.
Because if it doesn’t…
then the taxes aren’t rising because your house “got nicer.”
They’re rising because your property got reinterpreted by software.
And software, as we all know, has never made a mistake in history.
(Please ignore every Windows update ever.)

Comments